Gephi is an open-source network visualization tool. It helps researchers to explore trends, patterns, and outliers present within their datasets by creating graphs based on nodes (individuals) and edges (relationships or connections). Gephi is a tool for data analysts and scientists keen to explore and understand graphs. Like Photoshop™ but for graph data, the user interacts with the representation, manipulate the structures, shapes and colors to reveal hidden patterns. The goal is to help data analysts to make hypothesis, intuitively discover patterns, isolate structure singularities or faults during data sourcing. It is a complementary tool to traditional statistics, as visual thinking with interactive interfaces is now recognized to facilitate reasoning. This is a software for Exploratory Data Analysis, a paradigm appeared in the Visual Analytics field of research. No coding required.
Download: https://gephi.org/
Tutorial: Martin Grandjean's "Gephi–Introduction to Network Analysis and Visualization": http://www.martingrandjean.ch/gephi-introduction/
NetworkX is a Python package for the creation, manipulation, and study of the structure, dynamics, and functions of complex networks. This requires prior knowledge of Python coding. With NetworkX you can load and store networks in standard and nonstandard data formats, generate many types of random and classic networks, analyze network structure, build network models, design new network algorithms, draw networks, and much more.
Download Python: https://www.python.org/downloads/
Tutorial: DataCamp, https://www.datacamp.com/courses/network-analysis-in-python-part-1
Palladio is a product of the NEH Implementation grant (July 2013-June 2016), Networks in History: Data-driven tools for analyzing relationships across time. Our goal was to understand how to design graphical interfaces based on humanistic inquiry. We oriented the project around the development of a general-purpose suite of visualization and analytical tools based on the prototypes created for the Mapping the Republic of Letters project, which examines the scholarly communities and networks of knowledge during the period 1500-1800.
Download: http://palladio.designhumanities.org/#/
Nodegoat is conceptualised and developed by LAB1100. It allows scholars to build datasets based on their own data model and offers relational modes of analysis with spatial and chronological forms of contextualisation. By combining these elements within one environment, scholars are able to instantly process, analyse and visualise complex datasets relationally, diachronically and spatially; trailblazing.
Sign up: http://nodegoat.net/
Cytoscape is an open source software platform for visualizing molecular interaction networks and biological pathways and integrating these networks with annotations, gene expression profiles and other state data. Although Cytoscape was originally designed for biological research, now it is a general platform for complex network analysis and visualization. Cytoscape core distribution provides a basic set of features for data integration, analysis, and visualization. Additional features are available as Apps (formerly called Plugins). Apps are available for network and molecular profiling analyses, new layouts, additional file format support, scripting, and connection with databases. They may be developed by anyone using the Cytoscape open API based on Java™ technology and App community development is encouraged. Most of the Apps are freely available from Cytoscape App Store.
Download: http://www.cytoscape.org/

NodeXL is a data scraping, visualization, and analysis tool created by researchers at Microsoft Cambridge.
Click on the above logo to learn more about the software and to download the Excel plugin.
NodeXL (basic version) is a free add-on to Excel. It can be used for creating network visualizations, as discussed below in the Visualization and Analysis section of this LibGuide. With the reasonably-priced pro version, NodeXL can also be used for scraping API data from Twitter, Youtube, Flickr, and Wikipedia. Add: https://www.smrfoundation.org/nodexl/features/
Here is a brief outline of the steps to take when employing NodeXL. I would suggest playing with this tool a bit before officially starting your Twitter mining. Choose a search term or user that you know (from browsing Twitter) will provide you with dynamic data. Or, you can try some exploratory searches to "test" your methods.
open the NodeXL template, go to the NodeXL tab, click on "import," and choose if you want to search by user or search term
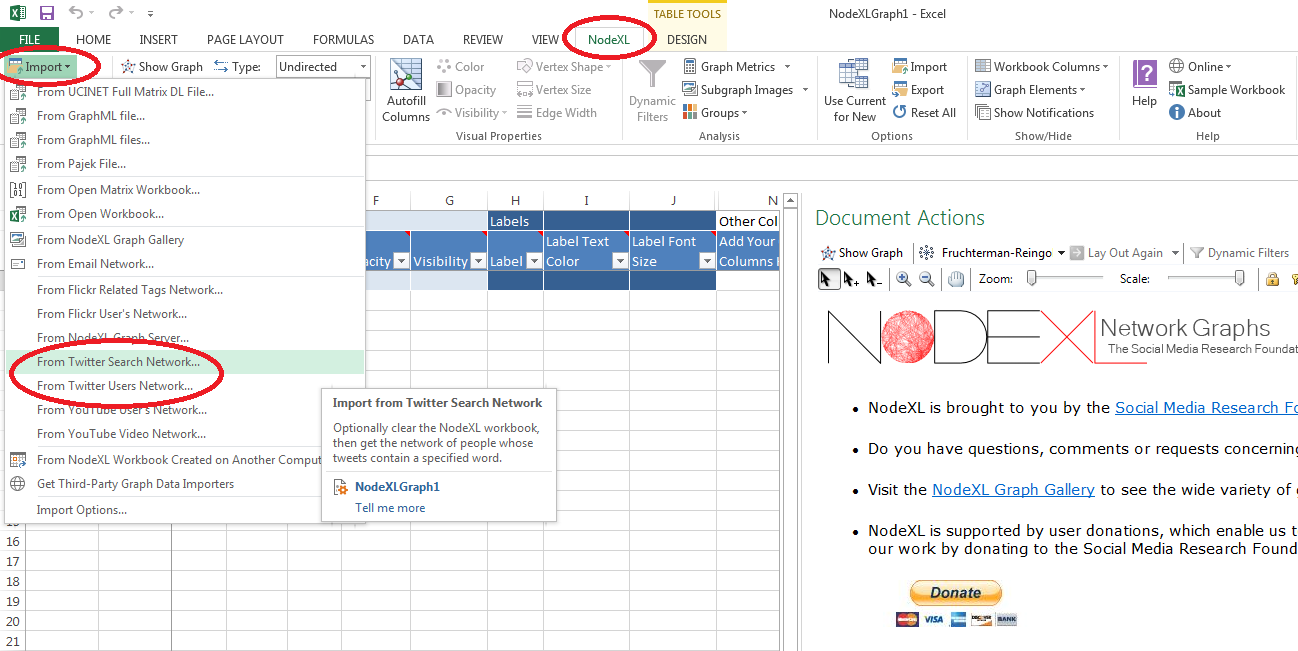
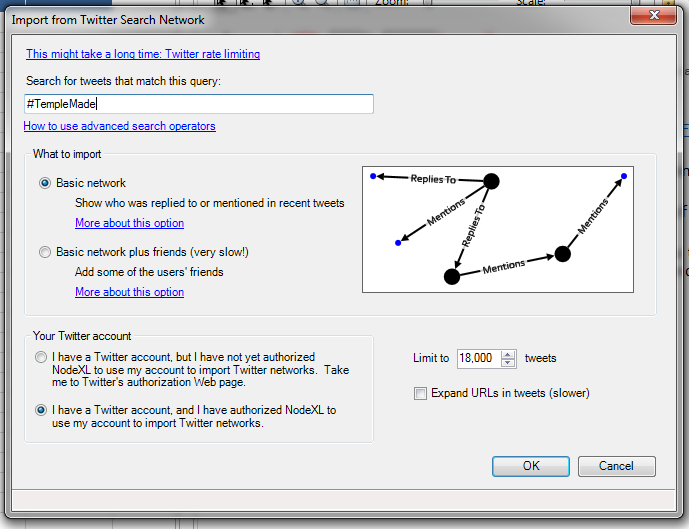
for this example I will use the search option. Type in your search term. Here I have chosen "Basic network" because Twitter limits how much data you can pull per 15 minutes. Therefore, if I ask for too much information (such as another level of friends and followers) I may have to wait several hours or days for the scrape to complete. Notice that you do have to have a Twitter account to run this program. Once you authorize the plug-in, it will remember you. Also notice that I have told the tool to "limit" my search to 18,000 tweets. This is actually the maximum this plug-in will scrape. So, if you want to get as much tweet content as possible, 18,000 is the way to go. As you can see from the box, this tool will not only tell us who has tweeted what, it will also create a network of who was "replied to" and "mentioned."
Now take a look at your data. Notice that there are tabs in your workbook. For example, "edges" and "vertices" each get their own sheet. You may find that you have to do some cleaning.
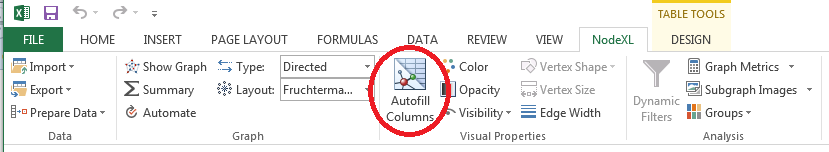
A great tool offered by NodeXL is the "Autofill" tool. This tool allows you to define parameters and change column settings for a whole sheet. This is obviously useful if you have thousands of rows of data.
There are many videos online that provide great starter tutorial. For instance, check out this video.
![]()
![]()
![]()