Skip to Main Content

Journalism

Research help for finding information related to Journalism practice and studies.

Why Use Data?

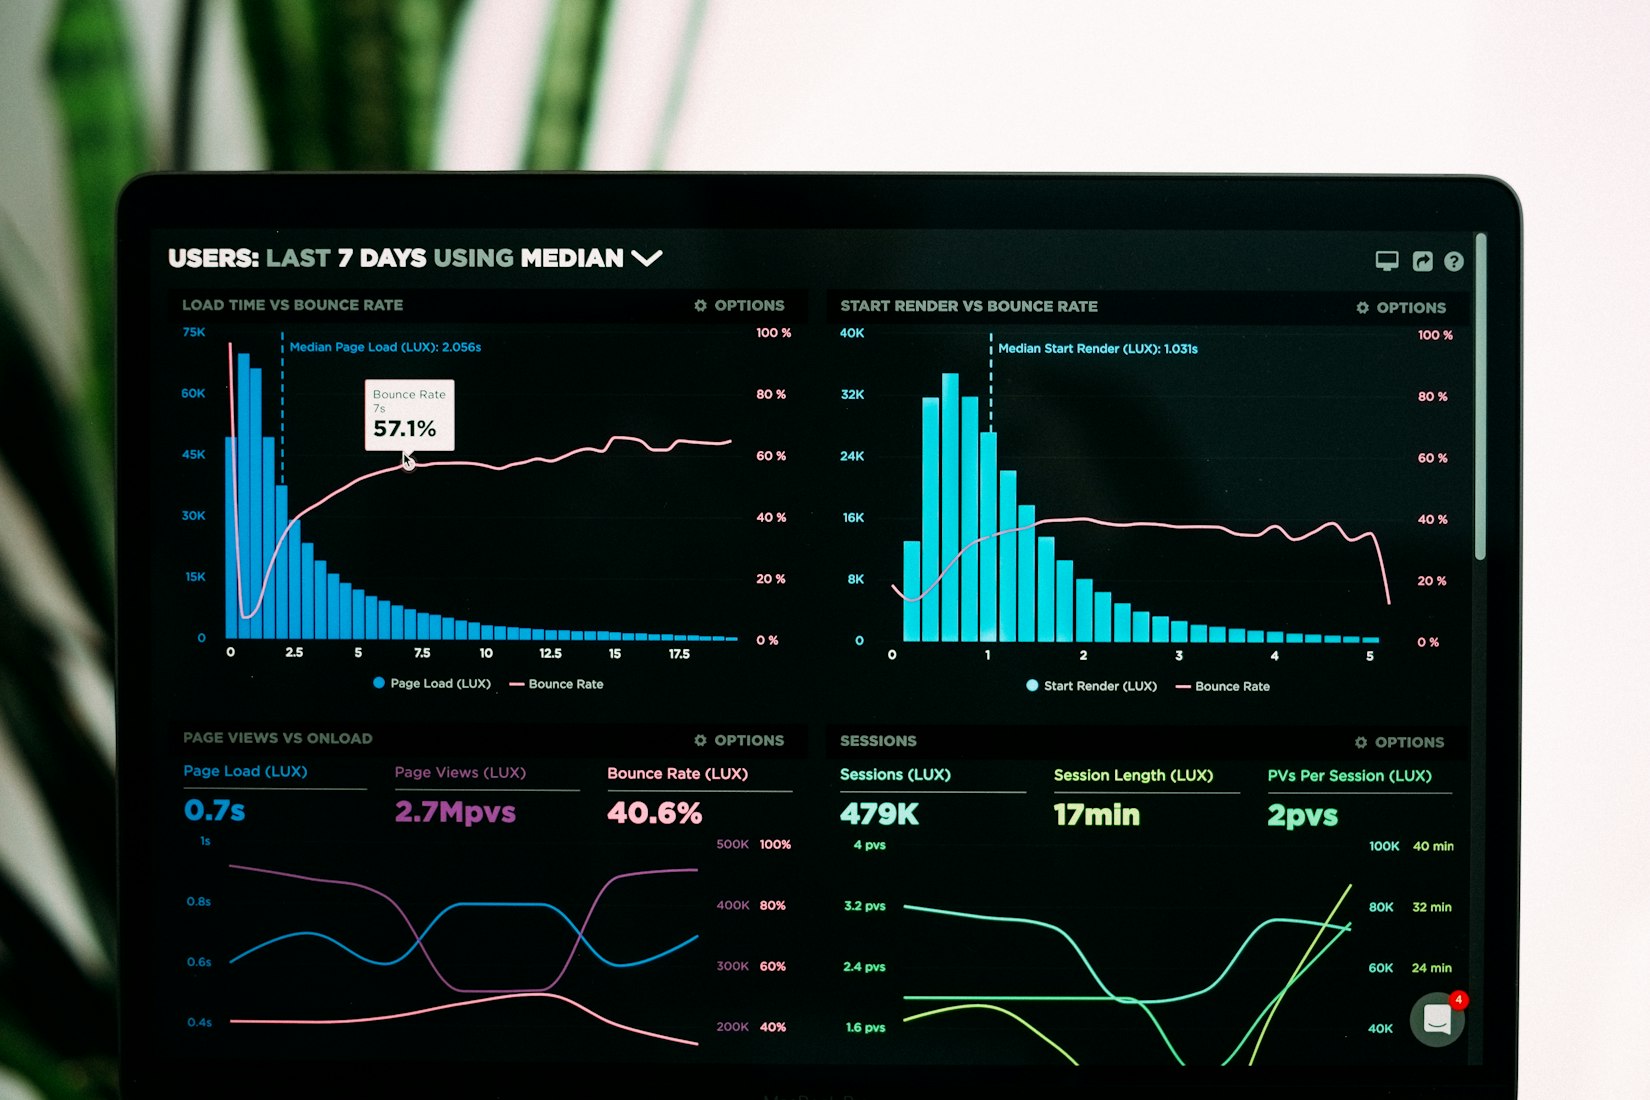
graph chartData is raw information. Data or data sets are primary sources that are the result of research studies or surveys. Statistics are the collection, organization, interpretation, and analysis of data. Statistics are found in tables, graphs, and charts.

When and Why You Should Use Data:

  • You need to clarify and put arguments into perspective
  • You need to identify trends, outliers, and patterns across seemingly disparate topics
  • You need demographic information about trends in local communities, across states, or at the national level

Remember: Data alone can't make the argument for you. Treat data as evidence that requires interpretation. Data is only as good as the people who create it, the quality of their work, and how well they relay their personal or organizational bias. 

Data + Maps Databases

Data Sources & Sets

Need data? Use the following databases to find demographic, economic, social, and political data on a variety of topics across time.

Public Opinion Polling Databases

Need to find public opinion polls? Use the following databases to find polling data on a variety of topics across time.

Data Visualization Tools

Examples of different charts by Yvette W from Pixabay

A Few Things to Consider

chartStatistics are perhaps the most difficult type of information to find.  Here are a few things to think about when trying to find a statistic:
  • Who cares about this information?
    Statistics cost a lot to collect. Who cares enough about the information to collect it? Some of the most common groups who collect statistics are the government, marketers, and associations.
  • The most recent statistic is probably not from this year.
    Because statistics take time and money to collect, the most recent statistic that you are likely to find may be a few years old.
  • Follow the trail.
    Finding statistics can sometimes be an exercise in detective work. Always look at the source of the statistic. If you read an article and it sites a source, consult that source. They may have additional statistics that weren't referenced in the article.
  • Evaluate the source.
    As with all information, you should evaluate the source providing the statistic. Are they biased? Is the group or website reliable? Do they cite the source of the statistic?
  • Read the statistic carefully.
    Be sure to pay close attention to any information provided surrounding how the statistic was collected, etc. You don't want to misrepresent the statistic in an article.